Quick Summary
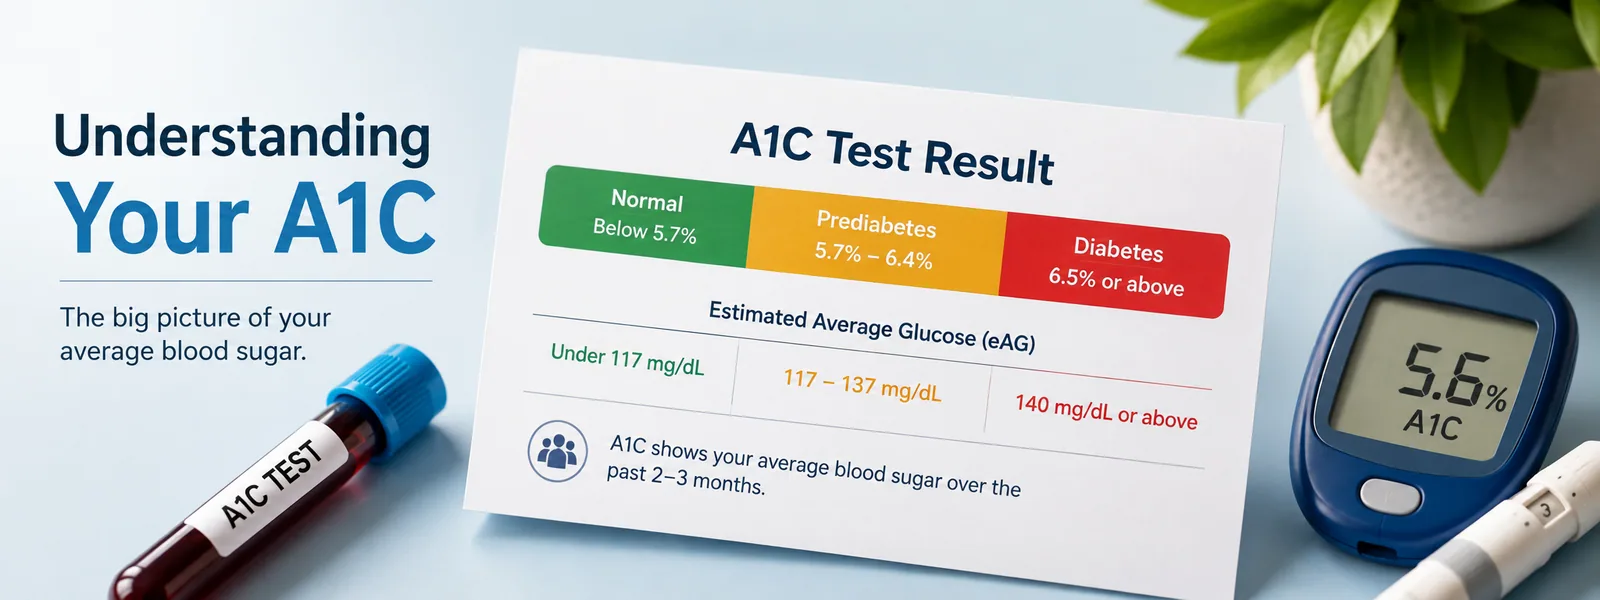
A1C reflects average blood glucose over two to three months. Below 5.7% is normal, 5.7–6.4% is prediabetes, and 6.5% or above indicates diabetes — though one result is not a diagnosis. Hemoglobin variants, anemia, recent blood loss, kidney disease, and pregnancy can all make the number unreliable.
An A1C result arrives as a single number with a percent sign and almost no context. It is one of the more consequential numbers in routine bloodwork, and one of the least explained at the point where you actually read it.
Here is what it measures, where the thresholds sit, and — the part usually left out — the circumstances in which the number is simply wrong.
What A1C Actually Measures
Glucose in your blood attaches to hemoglobin, the protein in red blood cells that carries oxygen. Once attached it stays attached for the life of the cell. A1C reports the percentage of your hemoglobin carrying glucose, so it reflects the average over roughly two to three months rather than the moment the sample was taken.
That is the entire advantage over a fasting glucose test. Fasting glucose is a snapshot, and it moves with what you ate yesterday, how you slept, and whether you were stressed on the morning of the draw. A1C cannot be tidied up by behaving well the week before an appointment — which is exactly why it is used.
An average also hides its own shape. Two people can return the same 7.0% while one sits steadily near 154 mg/dL and the other swings between lows and highs that cancel each other out. A1C cannot tell those two apart, which is much of why continuous glucose monitoring has become useful alongside it rather than as a replacement for it.
That hidden shape is why continuous glucose monitors have changed the conversation. A sensor sampling every few minutes produces something A1C cannot: the pattern behind the average. Two people at 7.0% can have entirely different days — one drifting gently, the other swinging between highs after meals and lows overnight that cancel out arithmetically while feeling nothing alike.
The measure that captures this is time in range, the proportion of the day spent within target. It is standard in type 1 diabetes care and increasingly used in type 2. It has not replaced A1C, which remains the reference for diagnosis and for long-term risk, but it answers a different and often more actionable question: not how high on average, but when and why.
What the Numbers Mean
The American Diabetes Association sets three bands. The right-hand column converts each into estimated average glucose, which is the same unit a home meter or continuous monitor reports — often the more intuitive way to read it:
| A1C | Category | Estimated average glucose |
|---|---|---|
| Below 5.7% | Normal | Under 117 mg/dL |
| 5.7% – 6.4% | Prediabetes | 117 – 137 mg/dL |
| 6.5% or above | Diabetes | 140 mg/dL or above |
One result above a threshold is not a diagnosis. Unless blood sugar is unequivocally high alongside clear symptoms, the standard is to confirm with a second test before anything is labeled. If a single number has put you in a new category, the next step is a repeat test, not a conclusion.
The conversion column also explains why your meter and your A1C can appear to disagree. A handful of fingerstick readings taken at convenient moments is a biased sample of a three-month average — the two matching exactly would be the surprising outcome.
If You Landed Between 5.7 and 6.4
This is the band most people are reading about, and it is genuinely useful information rather than a soft version of bad news. Prediabetes is not a milder diabetes; it is a signal, arriving early, about a trajectory that can still change.
The honest framing is that progression is common but not inevitable, and that structured lifestyle change has better evidence behind it here than almost anywhere else in preventive medicine. Where in the band you sit matters too: 5.8% and 6.4% are treated as the same category but are not the same situation, and the second warrants closer follow-up than the first.
When the Number Is Simply Wrong
A1C assumes your red blood cells live a normal lifespan and that your hemoglobin is the standard type. When either assumption breaks, the result can be misleading in ways that do not announce themselves on the report:
- Sickle cell trait and other hemoglobin variants, which can push results high or low depending on the lab's method
- Elevated fetal hemoglobin, which interferes with several common assays
- Anemia from iron, B12, or folate deficiency, which can read falsely high
- Recent blood loss or transfusion, which shortens or dilutes the record
- Advanced kidney disease and some liver disease
- Pregnancy, where red cell turnover changes and different targets apply
Sickle cell trait deserves particular attention, because it is common in people of African, Mediterranean, Middle Eastern, and South Asian descent, and many carriers do not know they have it. Depending on which method a lab uses, the same blood can produce a substantially high or substantially low A1C — enough to delay a diabetes diagnosis or prompt treatment that was never needed.
What Actually Moves the Number
If a result has landed in the prediabetes band, the reasonable next question is what changes it — and this is one of the better-answered questions in medicine, because it was tested directly at scale.
The Diabetes Prevention Program randomised 3,234 adults at high risk to one of three arms: an intensive lifestyle programme, metformin, or placebo. Over a mean follow-up of under three years, the lifestyle arm reduced progression to type 2 diabetes by 58 percent and the metformin arm by 31 percent. The trial was stopped early because the benefit was clear enough that continuing the placebo arm was no longer justified.
What the lifestyle arm actually asked of people is worth stating plainly, because it was specific rather than inspirational: a target of at least 7 percent body-weight loss, and at least 150 minutes a week of moderate physical activity. That is the intervention that outperformed a drug — not an elimination diet, not a supplement, and not a level of exertion most people would call extreme.
- Weight change does most of the work, and the threshold that mattered was modest — 7 percent, which for someone at 90 kg is about 6 kg
- Activity contributes independently of weight, partly by improving how readily muscle takes up glucose
- Carbohydrate quality shifts post-meal peaks more than total carbohydrate does, which is why the same gram count from lentils and from white bread behave differently
- Sleep and alcohol both affect glucose handling, and both are commonly overlooked when someone is focused on food alone
Two cautions on expectations. Because A1C reflects roughly the preceding two to three months, a change made this week will not show up in a test next week — retesting is usually at three months for this reason. And progression is common but not inevitable in either direction: the DPP reduced risk substantially, it did not eliminate it, and some people progress despite doing everything asked of them. That is a fact about biology, not a verdict on effort.
What to Do With the Result
A number below 5.7% with no risk factors means the test did its job and there is nothing to act on. In the prediabetes band, the useful next step is a conversation about repeat testing and what to change, rather than a search for a supplement. Above 6.5%, confirmation and a proper care plan belong with a doctor.
One more thing the single number conceals: if you are being treated for diabetes, the target itself is not universal. A tighter goal generally makes sense for someone younger, recently diagnosed, and without other significant conditions, because the benefit accrues over decades. A more relaxed goal often makes sense for someone older or frailer, or with a history of hypoglycaemia, because the harm of driving glucose low — falls, confusion, loss of independence — can outweigh the long-term gain they have time to collect. If your target differs from a figure you have read, that is usually deliberate, and it is a fair thing to ask your clinician to explain.
One thing worth resisting in every band: reading a single A1C as a verdict. It is an average over months, it carries real measurement error, and it is one input among several — weight, blood pressure, lipids, family history, and how you actually feel. The trend across results tells you far more than any one of them.
As for when to look again: three months is the usual interval when something has changed — a new medication, a deliberate change in diet or activity, or a first result in the prediabetes band. Anything sooner is measuring the previous quarter rather than the current one. Where a result is normal and there are no risk factors, routine rechecking is typically far less frequent, and your clinician will set it against your own picture rather than a general rule.
Frequently Asked Questions
What is a normal A1C level?
Below 5.7% is considered normal. From 5.7% to 6.4% is prediabetes, and 6.5% or above indicates diabetes. A single result above a threshold usually needs a second confirming test before it becomes a diagnosis.
Is an A1C of 5.7 bad?
It is the very bottom of the prediabetes range, which makes it an early signal rather than bad news. Progression is common but not inevitable, and structured lifestyle change has strong evidence at this stage. A repeat test is the sensible next step.
How far back does an A1C test look?
Roughly two to three months, matching the lifespan of a red blood cell. It is weighted toward recent weeks, though — about half the result reflects the previous month, so real changes show up sooner than three months.
Can you lower your A1C quickly?
Not within days. Because the test averages two to three months, changes take weeks to register regardless of how strictly you eat beforehand. That resistance to short-term effort is precisely why the test is used.
Can an A1C test be wrong?
Yes. Hemoglobin variants such as sickle cell trait, elevated fetal hemoglobin, anemia, recent blood loss or transfusion, advanced kidney disease, and pregnancy can all distort the result. Ask whether your lab's method is affected if any apply to you.
References
- American Diabetes Association Professional Practice Committee. "2. Diagnosis and Classification of Diabetes: Standards of Care in Diabetes—2026." Diabetes Care, 2026;49(Suppl 1):S27.
- Nathan DM, Kuenen J, Borg R, Zheng H, Schoenfeld D, Heine RJ. "Translating the A1C Assay Into Estimated Average Glucose Values." Diabetes Care, 2008;31(8):1473-1478.
- National Glycohemoglobin Standardization Program. "HbA1c Assay Interferences." NGSP, 2024.
- Centers for Disease Control and Prevention. "Sickle Cell Trait and Diabetes Tests: What You Should Know." CDC, 2023.
- Diabetes Prevention Program Research Group. "Reduction in the Incidence of Type 2 Diabetes with Lifestyle Intervention or Metformin." New England Journal of Medicine, 2002;346(6):393-403.